MESSAGE FROM KIM & JONATHAN
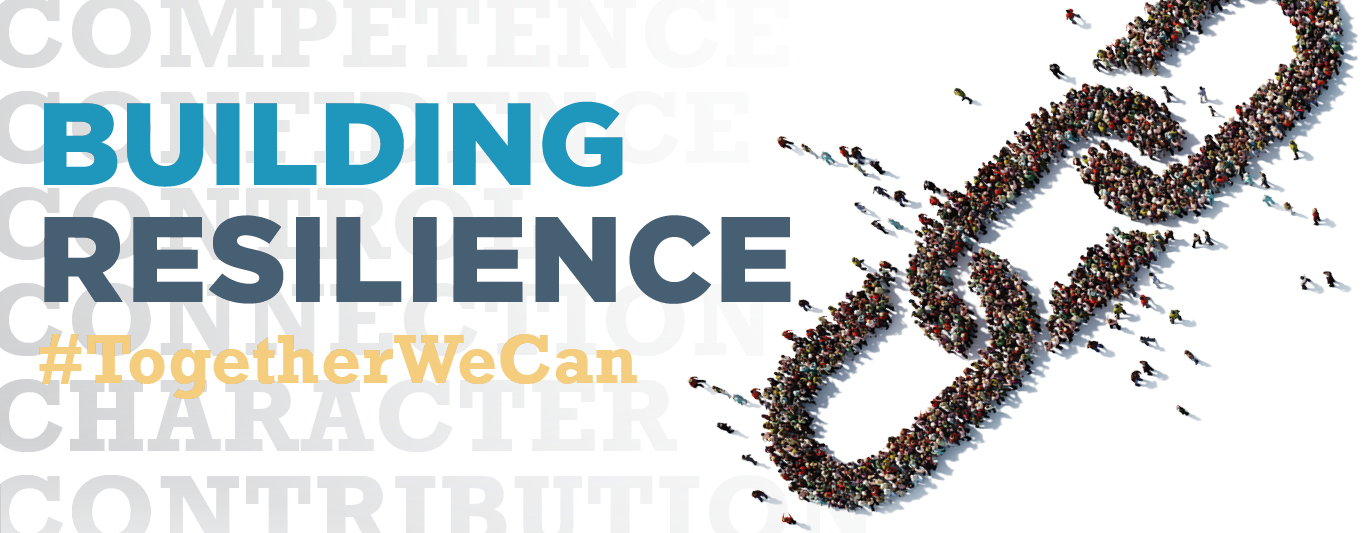
Job searching is often much more than just finding the right position, it’s about overcoming a variety of barriers that stand in our way. It requires resilience – the process of adapting to the stressors that can affect an individual’s ability to gain meaningful employment and growing stronger because of them.
The Seven Cs of Resilience, also known as the Essential Building Blocks, are identified as key to helping individuals cope and bounce back after challenges, changes, setbacks, disappointments, and failures. For each Essential Building Block, this year’s annual report highlights 7 incredible stories, each demonstrating a unique path to success despite adversity. Download our 2019-20 Annual Report here. #TogetherWeCan build resilience and ensure everyone has opportunities for employment.
President & CEO
Board Chair
SUCCESS STORIES
The 7 Cs of Resilience


Getachew's Story
Getachew, a new immigrant, was able to take advantage of JVS Toronto's ISAGE bridge training program to gain education equivalency and launch his career in Canada.

Hope's Story
With the help of JVS Toronto's YouthReach program, Hope was able to complete pre-apprenticeship training to build her knowledge and skills for her new career.

Lisa's Story
Lisa is an Associate Director at UJA who is dedicated to hiring more high quality candidates from JVS Toronto’s Jewish community programs such as EMETemployment.

Nathan's Story
Nathan had a Psychovocational Assessment which helped identify an undiagnosed condition as well as the aptitudes he possessed to succeed.
Nadine's Story
Nadine is a volunteer mentor with Canada InfoNet who works with new immigrants before they arrive in Canada to help in their transition to a new country.

Robert's Story
Robert joined the ASD Job Readiness Program at JVS Toronto to overcome his barriers and found a career path he is passionate about.

Zianne's Story
Zianne received management, finance and marketing strategy tips in addition to a grant from the Youth Entrepreneur Program to help grow her small business.
BY THE NUMBERS
13,044
individuals served across all programs
30,963
unique services accessed by individuals
71%
of individuals served gained employment or education
6,022
employers in our database
197
funders and donors generously provided support
7,545
volunteer hours contributed by over 368 volunteers
311
partnerships with organizations internationally
163
dedicated employees at JVS Toronto
OUR SUPPORTERS IN 2019-2020
Thank you for supporting our vision that every individual has opportunities for employment.
Funders
Federal
Immigration, Refugees and Citizenship Canada
Provincial
Ministry of Training, Colleges and Universities
Ministry of Children, Community and Social Services
Ministry of Economic Development, Job Creation and Trade
Municipal
Other
UJA Federation of Greater Toronto
Donors $500 - $50,000+
$50,000+
Freedman Family
The Friedberg Charitable Foundation/Dov Friedberg
$10,000 to $49,999
David Green, Daphne Wagner, Lita and Mikey Green
Faith Goldman Family Fund at the Jewish Foundation of Greater Toronto
Holdbest Foundation
Ida Lover Charitable Endowment Fund at the Jewish Foundation of Greater Toronto
Robert and Ellen Eisenberg
$5,000 to $9,999
Gary Bluestein Charitable Foundation
Gold and Shainfarber Family
Joseph and Elaine Steiner
Judith Teller Foundation
XBASE Technologies Corporation
$1,000 to $4,999
Anonymous
Audrey Loeb
Brian Rowe and Katharyn Webb
Canadian Friends of Israel Elwyn
David and Eileen Berger
Earl (Mann) Zimmerman Charitable Fund at the Jewish Foundation of Greater Toronto
Jeffrey and Lydia Goldfarb
John and Susan Rose
Kim Coulter and David Safarian
Mark & Mira Shnier Charitable Fund at the Jewish Foundation of Greater Toronto
Merle Friedman
Ruth & Lony Gropper Endowment Fund at the Jewish Foundation of Greater Toronto
Stanley and Rhonda Gordon
William and Helene Skolnik
$500 to $999
ABC Life Literacy Canada
Anonymous
Anonymous
Ariella Fuhrmann
Avi Pollock and Nicole Shuckett
Des and Anne Levin
Dr Daniel and Beatrice Traub-Werner
Fred and Joyce Zemans
Gil and Gail Faclier
Gladys Rose
Harriet Bain
Ivor and Renee Simmons
Jonathan and Merick Kopman
Lawrence Enkin
Louis & Salome Berger UJA Federation Philanthropic Fund at the Jewish Foundation of Greater Toronto
Moshe and Ena Greengarten
Paul and Carrie Habert
PWC Canada
Rashmi Nathwani
Sam Lightstone
Simon and Gaby Fisch
Toronto Commercial Real Estate Women
Donors Under $500
Under $500
Ab and Phyllis Flatt
Adina Ander
Arielle Salama
Avi Berger
Barry Sniderman
Baruch Lipinsky
Betty Cohen
Brian and Sharon Cardie
Buddy and Leigh Eisenberg
CanadaHelps
Carrie Klians
Charlotte Nowack
Cheryl Blinick
Daniel Wilson and Amy Ticoll
David and Nancy Goldbloom
David McCulloch
David S. Wilson Professional Corporation
Deanna Peranson
Debbie Chabot
Debbie Hollend
Donna Chabot
Donna Kirsh
Doreen and Robert Scolnick
Dr Barry and Helen Goldlist
Dr Ester Cole
Dr Melvin and Sandy Brown
Elliott and Wendy Eisen
Engelite Charitable Foundation
Erica Caruso
Erin Payne
Esther Moldofsky
Fern Cogan
Fern Silver
Fiona Orr
Frank Miller
Gail and Alex Motzok
Gerry and Sonia Rowan
Gilad Epstein
Glenn and Cindy Ip
Harold and Ethel Freeman
Harry and Esta Palter
Harvey and Carol Hacker
Igor and Bonnie Korenzvit
Irena Qatipi
Irving Matlow
Jack and Marilyn Holtzman
Jay and Allison Steinberg
Jeffrey Gauze
Jo-Anne Lamonday
John Berke
Jon Ennis and Janice Karlinsky
Jonathan and Diane Wilson
Kaitlin Murray
Karen and Sydney Goldenberg
Kuntal Shah
Laura Torrance
Lee and Ruth Abrahamson
Lesly Lachance
Lola Rasminsky
Ludmila Vokac
Mark Goldasic
Mark Goodbaum and Linda Ander
Mark Libman
Martin and Estelle Kosoy
Martinway Plaza Limited
Marvin Zweig
Michael and Henrietta Kestenbaum
Mitchel Smith and Lili Little
Mona Levenstein
Murray and Ellen Blankstein
Nancy Singer
Neela Saldanha
Neena Gupta
Nelly Teitelbaum
Nicholas Abelardo
Nicole and Sean Diamond
Noah Shack
Otto F. Veidlinger
Paul and Barbara Bernstein
Paula Keyfitz
Pearl and Richard Goodman
Pearlene Halfin
Peter Shenfield
Phyllise Gelfand
Prabhas Jha
Qi Hi
Renee Levine
Richard Mccallion
Robert and Judith Habert
Robert Gauthier
Robert Herman
Robert Skolnik and Judi Swartz
Russell and Jane Rendely
Samuel Kolber
Sandra Goren
Sandra Kleinman
Sandy Stern
Saul and Cindy Goodman
Seoan Oh
Sharon Dagan
Silvana Saballos
Sosan Majidi
Stan and Ruth Swartzman
Stan and Sue Goldfarb
Stanley and Gail Rapkin
Stephen Dafoe
Stewart and Jacqueline Irvine
Susan Jenkinson
Sybil Milstone
Tamara Novik
Terri and Stephen Weintraub
Title Textile Company
Victoria Kent
Wayne Burns
Wayne Haymer
Wendy Glaser
Wendy Orbach
Yahav Barnea
Yelena Stepanyan
Yoel B. Abells
Yonit Fuhrmann
Zita Gardner
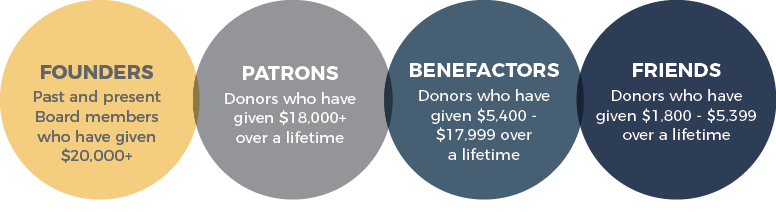
As a token of gratitude, we are pleased to recognize our donors within Lifetime Giving Circles.
Founders' Circle
$20,000+
Anonymous
Elliott Eisen
Glennie Lindenberg
Helen Goldlist
Hugh Furneaux
Jeffrey Goldfarb
Mark Zaretsky
Ruth Abrahamson
Patrons' Circle
$200,000+
CIBC
David Green, Daphne Wagner, Lita and Mikey Green
David z″l and Eunice Mouckley z″l
Freedman Family
The Friedberg Charitable Foundation/Dov Friedberg
The Schulich Foundation
$100,000 – $199,999
Al z″l and Malka Green z″l
Irving and Toddy Granovsky
Judith Teller Foundation
XBASE Technologies Corporation
$50,000 – $99,999
Anonymous
Bernard Berger z″l
Children’s Aid Foundation
Dr Barry and Helen Goldlist
Elliott and Wendy Eisen
Gary Bluestein Charitable Foundation
Holdbest Foundation
Karen and Sydney Goldenberg
Martin and Joan Goldfarb
Prosper Canada
RBC Foundation
Robert and Ellen Eisenberg
Ruderman Family Foundation
Thomas and Annie Kohn z″l
$25,000 – $49,999
Al Libfeld
Broadridge Financial Solutions (Canada) Inc.
Hugh Furneaux
Intact Foundation
Jeffrey and Lydia Goldfarb and Family
Lee and Ruth Abrahamson
Mark and Lindy Zaretsky
Martin Copeland
Nathan and Glennie Lindenberg
Philip Anisman
Reuben Klein
Stanley and Rhonda Gordon
Sydney and Florence Cooper
TD Bank Financial Group
The Dan-Hytman Family Foundation
The Oakville Foundation For Intellectually Handicapped People
Trans4mation Solutions Consulting Inc.
$18,000 – $24,999
BMO Financial Group
Brooke Foundation
Canadian Friends of Israel Elwyn
Fabricland Distributors Inc.
Jack and Judy Winberg
Manulife Financial
Paul and Carrie Habert
Playtime Bowl
Stephen and Wendy Cole
William and Helene Skolnik
Benefactors' Circle
$10,000 – $17,999
AIM Trimark
Alan Greenberg
Bernard and Carole Zucker
BT/A Advertising
David and Anita Katz
David and Eileen Berger
Dr Peter Herman and Dr Janet Polivy
Florence Minz
Ganz Family Foundation
Gluskin Sheff + Associates Inc.
Harold and Ethel Freeman
IBM Canada Ltd.
Ivor and Renee Simmons
John and Susan Rose
Jonathan and Merick Kopman
Joseph and Elaine Steiner
Kim Coulter and David Safarian
KRG Children’s Charitable Foundation
Lawrence Enkin
Leon Judah Blackmore Foundation
Lola Rasminsky, C.M.
Manny Mitchell z”l and Merle Friedman
Michel Silberfeld and Susan Fremes
Morland Brown
Rose Corporation
Sam and Barbara Stupp
Scotiabank Group
Shell Canada Limited
Simon and Gaby Fisch
Stanley and Gail Rapkin
Sun Life Financial
TELUS
The Lawrence and Judith Tanenbaum Family Foundation
The Les and Minda Feldman Charitable Foundation
The Linda Frum & Howard Sokolowski Charitable Foundation
Thomson Reuters
Vivah Jewellery
Walmart Canada Corp.
$5,400 – $9,999
Ab and Phyllis Flatt
Allstream
AV-Canada
Audrey Loeb
Ben and Hilda Katz Charitable Foundation
Brookfield
Canadian Forces Recruiting Centre
Charles Pachter
DCS Telecom Ltd.
Dr Morris (Mickey) & Maureen Milner
Edward z″l and Suzy Greenspan
Gerald and Elaine Yaffe
Gerry and Gay Lokash
Gil and Gail Faclier
Hazcon Group Ltd.
Home Depot of Canada Inc.
Imperial Coffee and Services Inc.
Jeffrey Gustin and Susan Smith
Jerry and Carolin Michaels
Jewish Family & Child Foundation
John and Myrna Daniels Charitable Foundation
Johnson – Rose Inc.
Joseph z″l and Betty Skolnik z″l
Leslie Smyth
Lonsdale Gallery
Lorne Wolfson and Lorie Shekter-Wolfson
MarketingWarehouse.com
Martin and Marlene Rochwerg
McDonald’s Restaurants of Canada Limited
Morton and Rosemary Goldhar
Perry and Elaine Stupp
Peter Shenfield
Progress Luv2Pak International Ltd.
Ralph & Roslyn Halbert Foundation
REENA
Richard Borchiver and Elaine Naiberg
Richard Venn and Carol Mitchell
Rick Ekstein
RioCan Real Estate Investment Trust
Rogers Communications Inc.
Ron Kramer and Selma Edelstone
Russell Investments Canada Ltd.
Sandy Keshen
Sharon Herman
State Building Group
Stuart Ducoffe
The Ouellette Family Foundation
The Rotman Family Foundation
Thesign Construction Management Inc.
The Windward Foundation
Tiffany & Co. Canada
Tina Tehranchian
Torys LLP
Truster Zweig LLP
Wayne Squibb
Winberg Foundation
Yuri Dojc
Friends' Circle
$3,600 – $5,399
Anonymous
AGF Management Ltd.
Albert Gelman Inc.
Brian Rowe and Katharyn Webb
CI Investments Inc.
Crowe Soberman LLP
David and Patty Rubin
Dr Daniel and Beatrice Traub-Werner
Dr Melvin and Sandy Brown
Dr Reena Kronitz
Dubwear Clothing Co.
Elderwood Foundation
Empire Life
Four Seasons Hotels Limited
Gary and Tamara Fine
George Brown College
George Fine and Lois Friedman
Harvey Kalles Real Estate Ltd.
Ivari
Joanne Smith Cutler
KIK Corporation
Lynda Brest
Martin Bloomberg
Mary Tripi
Melvyn and Marcia Eisen
Miller Thomson LLP
Minto Foundation Inc.
Nicole and Sean Diamond
Paul Deegan and Rebecca Goldfarb
Paul Orlander and Helayna Shekter
Peter and Bonnie Levy
Real Property Management
Reconnect Mental Health Services
Rhonda Richer
Richter LLP
Robert and Judith Habert
RONA Foundation
Ruby Wong
Sharon Cohen
Stan and Ann Leibel
Stuart Mitchell and Fran Rasminsky
Suhana Meharchand
The Anne Butler Slaght Foundation
The McLean Foundation
Tim Hortons
Title Textile Company.
$1,800 – $3,599
4 Office Automation Ltd.
Alan Keith
Alexander E. Grossman Foundation
Alex Mayer
Allen and Sharon Karp
Andrew Rotenberg
Andrew and Fay Weisberg
Anonymous
Anonymous
Anonymous
Avi Berger
Avi Pollock and Nicole Shuckett
Bernard and Frances Goldman
Bernard and Nancy Kraft
Best Buy Canada
Bill Woodley
Billy Bee Honey Products Limited
BMO Life Assurance Company
Brenda Proulx
Brian Korson
Bridlepath Properties Management Inc.
Brown & Cohen Communications & Public Affairs
Brown Group of Companies
Buddy and Leigh Eisenberg
Circle of Care, Sinai Health System
Channel 1 Media Solutions Inc.
Chartered Professional Accountants of Ontario
Corbin Visual
CTV
Cummings, Cooper, Schusheim & Berliner LLP
D+H Limited Partnership
David and Mary Saunders
David Smyth
David Walsh
Deanna Peranson
Dr Hadley Koltun
Dufferin Business Centre Inc.
Elaine Lester
Engelite Charitable Foundation
EY
Frum Foundation
Firefly Advisory Services Inc.
Fogler, Rubinoff LLP
Fred and Joyce Zemans
Gerald Epstein
Gerold and Roslyn Goldlist
Gerry z″l and May Cohen
Gertex Hosiery Inc.
Gilad Epstein
Global Upholstery Co. Inc.
Greenhouse Graphics
Greg and Linda Wolfond
Harriet Bain
Harvey and Carol Hacker
Harweg Foundation
Hatch Ltd.
Holy Trinity Anglican Church
Hugh and Katherine Saunders
Humber College
Hy and Joan Eiley
Hydro One Inc.
Igor and Bonnie Korenzvit
INKAS®
Irving Borchiver z″l
Irving Matlow
Jackman Foundation
Janice and Sheldon Baryshnik
Jim Mackay
Joel and Adrienne Slan
Jon Ennis and Janice Karlinsky
Junior League of Toronto
Kathleen Barret
Kenneth D. Campbell Consulting
Kroll Computer Systems Inc.
Larry W. Rich
Leo & Sala Goldhar Foundation
Leon and Jocelyn Kadish
Lisa Woznica
Mackenzie Investments
Maple Leaf Sports and Entertainment Ltd.
Marc and Joy Koplowitz
Marilyn Herbert
Mark Smith and Anne Larson
Martin and Barbara Slater
Martin and Judith Friedland
Marvin Sadowski
McCarthy Tetrault LLP
Media Profile
Megan Thomas
Melanie Braga
Mick Mitrovic
MLSE Foundation
Mona Levenstein
Murray and Ellen Blankstein
Nahla Hanna
Naomi Judith Rose z″l
Nava Jakubovicz
Olga Fershaloff
Patrick Perdue
Penguin Random House
Piggyback Design + Communication
Raisyl Mandel
Richard Davis
Richard Krelstein
Robert and Dorothy Till
Robert and Sharon Myatt
Robert and Sheila Masters
Robert Hall, Q.C.
Ron and Anne Golden
Ron Kaplansky
Rose Baum
Russell and Jane Rendely
Senator Jerry Grafstein
Sensible Heating & Air Conditioning
Shibley Righton LLP
Shoppers Drug Mart
Sonic Print
Sporting Life
Stanley Kugelmass and Marjorie Hecht-Kugelmass
Stephen and Heshy Altbaum
Steps Foundation Inc.
Steven and Rodeen Stein
Stewart and Jacqueline Irvine
St. George’s Anglican Church
St. Matthew The Apostle Anglican Church, Oriole
Temple Emanu-El
The Goodman Family Foundation
The Leonard & Felicie Blatt Foundation
The Sam Sorbara Charitable Foundation
Thomas Schwartz
Toronto Blue Jays Baseball Club
UCAN Fastening Products
Union Lighting & Furnishings
Victoria Granger
Wayne Tanenbaum Charitable Foundation
Yale and Partners LLP
Zita Gardner
FINANCIALS
Revenue
Federal, Provincial and Municipal Grants
Fees For Service and Other
UJA Federation
United Way Greater Toronto
Donations Recognized
Per the deferred contribution method
Total
Total Donations Received in Fiscal Year
2020
14,272,767
1,185,818
345,952
619,891
161,353
$16,585,781
–
143,680
2019
1,262,685
242,594
571,116
154,043
$17,130,60
–
127,136
Expenses
Employment and Career Services
Disability Services
Newcomer Services
Employment Centres
Youth Services
Assessment and Education Services
Training and Other Services
Administration
Amortization and Other
Total
Net Surplus/(Deficit)
2020
386,033
1,637,778
2,445,214
5,856,374
2,080,828
968,164
877,735
1,834,917
301,976
$16,389,019
196,762
2019
346,847
1,535,315
2,368,936
6,033,776
2,155,109
1,128,827
1,267,976
1,735,270
229,389
$16,801,445
329,156
Where We Spent Our Revenue in 2019-20
▇ Employment Centres: 35.73%
▇ Newcomer Services: 14.92%
▇ Youth Services: 12.70%
▇ Administration: 11.20%
▇ Disability Services: 9.99%
▇ Assessment and Education Services: 5.91%
▇ Training and Other Services: 5.36%
▇ Employment and Career Services: 2.36%
▇ Amortization and Other: 1.83%
